CMS Performance Benchmarks: What to Test (2026)
What to measure, how to set up the load test, the 5 scenarios that matter, and how to compare across CMSes without misleading yourself.
Most CMS performance comparisons online are useless. They test the home page once with Lighthouse, screenshot the score, and call it a benchmark. The real question — "how does this CMS perform under realistic load with realistic content?" — usually goes unanswered until production breaks.
This post is the methodology guide for actually benchmarking CMS performance in 2026 — what to measure, how to set up the load test, the 5 scenarios that matter, and how to compare across CMSes fairly. TL;DR: measure TTFB, LCP, INP, query count, and memory across 5 realistic scenarios (cold-cache home, logged-in admin, search results, image-heavy gallery, API endpoint), with same content volume and same hardware on each candidate. Most CMS comparisons fail because they test only the home page, use empty content sets, or compare managed-WordPress to a bare-VPS modern CMS without normalizing the infrastructure.
The audience: developers running CMS evaluation, agencies pricing platform recommendations, CTOs deciding whether to migrate. If you're picking between 2-3 CMSes and performance is a deciding factor, this post is the testing playbook. For the broader evaluation framework, see how to choose a headless CMS: 10-point checklist.
What to Actually Measure
CMS performance isn't one number — it's a vector of measurements that each catch a different failure mode. The metrics that matter:
Server-side metrics:
- TTFB (Time to First Byte) — how long from request to the first response byte. Catches backend slowness: PHP boot time, database queries, plugin overhead. Good: under 200ms. Acceptable: under 600ms. Bad: above 800ms.
- Database query count per page — how many SQL queries fire per request. Clean WordPress: 12-15. Bloated WordPress: 80-150. Modern CMS on a typical content page: 5-20. Catches plugin bloat and N+1 query patterns.
- PHP memory peak — how much RAM the request used at peak. Matters because shared hosting and managed tiers cap memory; pages near the cap fail under load. Healthy: under 64MB per request. Bad: over 256MB.
- Database query time — total ms spent on SQL. A page with 100 queries totaling 50ms is fine; 30 queries totaling 800ms isn't. Use Query Monitor (WordPress), Laravel Debugbar, or whatever your CMS exposes.
Frontend metrics:
- LCP (Largest Contentful Paint) — when the largest above-fold element renders. Google's threshold for "good" is 2.5s. Median WordPress mobile is 3.2s; median modern stack is 1.8s.
- INP (Interaction to Next Paint) — how long the page takes to respond to user input. Replaces FID as of 2024. Good: under 200ms. Bad: above 500ms.
- CLS (Cumulative Layout Shift) — visual stability. Good: under 0.1. Catches lazy-loaded images without dimensions, late-loading ads, font swaps.
- Total page weight — combined size of HTML + CSS + JS + images + fonts. Healthy: under 1MB on initial load. Bloated: over 3MB.
Build-time metrics (if your CMS has a build step):
- Cold build time — fresh build with no cache. Matters for CI/CD and deployment.
- Incremental rebuild time — change one file, rebuild. Matters for dev iteration.
The single most overlooked number in CMS evaluation is TTFB. It's the cleanest signal of backend health, doesn't depend on browser rendering, and you can measure it with one curl command:
curl -w "TTFB: %{time_starttransfer}s\nTotal: %{time_total}s\n" -o /dev/null -s https://yoursite.com/some-page
Run that 5-10 times against each candidate. The variance tells you whether the backend is consistent or randomly slow. For deeper context on why TTFB matters per Google's ranking signals, see headless CMS and SEO: what actually matters in 2026.
Load Test Setup: Tools That Actually Tell You Things
The benchmarking toolchain depends on what you're testing. Here's the practical kit:
For frontend Core Web Vitals:
- Lighthouse CI — automated Lighthouse runs in your pipeline. Configure to run on 5-10 representative URLs, store the results, alert on regression. Free, runs anywhere.
- WebPageTest — slower, more thorough, gives you the filmstrip and waterfall. Good for one-off deep dives. Free tier limited; paid from $15/month.
- PageSpeed Insights — runs Lighthouse plus pulls real-user CrUX data when available. Use it for sanity checks; don't use it as the only data source.
For server-side load testing:
- k6 — Go-based load tester, scriptable in JavaScript. Modern alternative to JMeter. Free, open source. Run from your machine or k6 Cloud.
- Apache Bench (
ab) — simple, ancient, ships with most Linux distros. Good for "send 1000 requests with 10 concurrent" smoke tests. Limited but free. - wrk — high-performance HTTP benchmarking tool. Better than
abfor high-concurrency tests. Free.
For database query analysis:
- Query Monitor (WordPress) — shows every query, who triggered it, how long it took
- Laravel Debugbar — same idea for Laravel-based CMSes (UnfoldCMS, Statamic with Eloquent)
pg_stat_statementsextension (Postgres) — aggregate query stats over time- MySQL slow query log — set
long_query_time = 0.05to log queries above 50ms
For real-user data:
- Cloudflare Web Analytics — privacy-friendly, free, gives Core Web Vitals from real users
- Plausible / Fathom — both have basic performance tracking
- GA4 — has Core Web Vitals as built-in metrics
- Google Search Console — Core Web Vitals report aggregated by page type
A minimal k6 script for CMS load testing:
import http from 'k6/http';
import { sleep, check } from 'k6';

export const options = {
  vus: 10,           // 10 virtual users
  duration: '60s',   // for 60 seconds
};

export default function () {
  const res = http.get('https://yoursite.com/blog/some-post');
  check(res, {
    'status is 200': (r) => r.status === 200,
    'TTFB under 600ms': (r) => r.timings.waiting < 600,
    'response under 2s': (r) => r.timings.duration < 2000,
  });
  sleep(1);
}
Run k6 run script.js and you get TTFB, total response time, and throughput per virtual user. Run the same script against each candidate CMS and the numbers tell the story.
The 5 Scenarios That Matter
Most CMS benchmarks test the home page and call it done. Real-world performance varies wildly across page types. The 5 scenarios that catch the actual differences:
Scenario 1: Cold-Cache Home Page
What it tests: bare-bones page render with no cache help. Measures backend speed, plugin overhead, and theme bloat.
How to set up: clear all caches (page cache, object cache, OPcache if testable). Hit the home page once. Measure TTFB, LCP, query count.
What good looks like: TTFB under 300ms, LCP under 2s, queries under 30. Anything worse means the backend is slow before any cache helps.
What it catches: plugin overhead, slow theme rendering, unoptimized PHP. This is where WordPress sites with 25+ plugins routinely fail (TTFB above 1,000ms).
Scenario 2: Logged-In Admin Page
What it tests: workflow performance for editors, where caching usually doesn't apply. Most caching plugins skip logged-in users entirely.
How to set up: log into the admin, navigate to the post-list page. Measure TTFB, query count, time-to-interactive.
What good looks like: TTFB under 400ms, queries under 50, page interactive within 1.5s.
What it catches: admin slowness, which is invisible to anonymous visitors but kills editor productivity. WordPress admin on bloated sites routinely takes 3-5 seconds per page; modern CMS admins typically stay under 500ms. Editors notice.
Scenario 3: Search Results
What it tests: dynamic queries that bypass cache. Search results have high cardinality (every query is unique), so they always hit the backend.
How to set up: hit the search endpoint with a real query that returns 10-50 results. Measure response time and query count.
What good looks like: response under 500ms with full-text search index in place. Without an index, response can be 2-5 seconds on databases with 10K+ posts.
What it catches: missing search indexes, slow LIKE '%query%' queries, lack of search engine integration (Algolia, Meilisearch, Elasticsearch). For CMSes evaluating against this, see the headless CMS evaluation checklist — search performance is often a separate evaluation track.
Scenario 4: Image-Heavy Gallery Page
What it tests: how the CMS serves images at scale — auto-format conversion, responsive sizes, lazy loading, CDN integration.
How to set up: build a page with 30+ images of mixed sizes. Open in Chrome DevTools, Network panel filtered to images. Note total image bytes, count of image requests, time-to-LCP.
What good looks like: automatic WebP/AVIF conversion (saves 30% bytes), lazy loading below fold, srcset for responsive sizes, CDN delivery. Total image bytes for a 30-image page should be under 1.5MB on first load.
What it catches: CMSes serving raw uploads without format conversion (WordPress without an image plugin), missing responsive image generation, no CDN configured. DatoCMS and Sanity have excellent image pipelines; WordPress requires plugin help (ShortPixel, Smush); modern self-hosted CMSes vary.
Scenario 5: API Endpoint Response
What it tests: API performance for headless or hybrid CMS use. Measures auth overhead, query depth, and serialization speed.
How to set up: hit the public REST or GraphQL endpoint with a realistic query (10 posts with relations populated). Measure response time, payload size, query count on the backend.
What good looks like: response under 300ms with proper auth, payload under 100KB for 10 records, no N+1 queries on the populated relations.
What it catches: poorly-designed APIs that hit N+1 queries on populates (Strapi has historically struggled here), large default payload sizes (Contentful's per-record overhead), slow GraphQL resolvers. For framework-CMS pairings see the best CMS for React developers in 2026.
How to Compare CMSes Fairly
The most common benchmarking failure: comparing CMSes on different infrastructure and pretending the numbers are comparable. A managed-WordPress site on Kinsta with Redis enabled and Cloudflare in front is not fairly comparable to a self-hosted Strapi on a $5 DigitalOcean VPS. The fairness rules:
1. Same hardware tier.
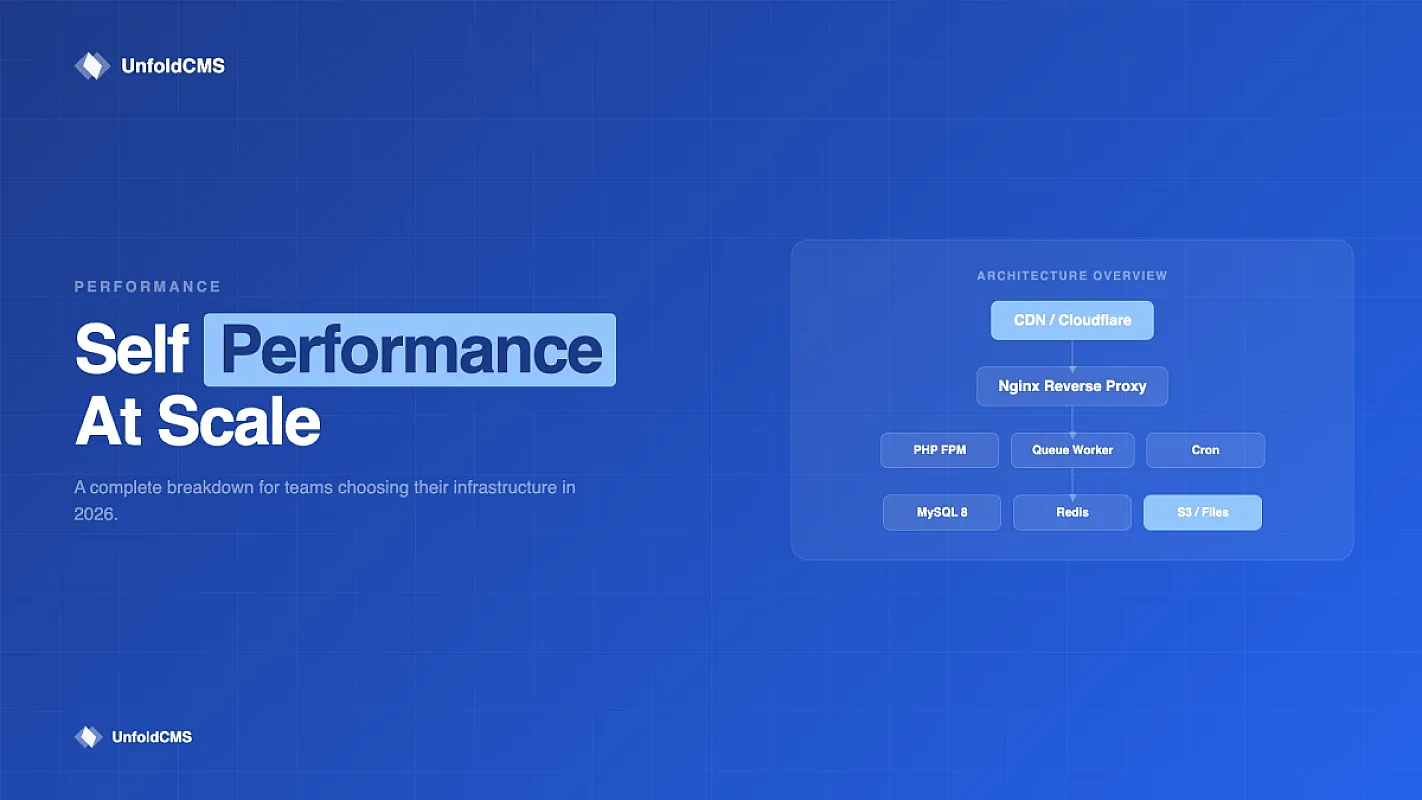
If you're testing 3 CMSes, run all 3 on equivalent hardware. A reasonable baseline: a $20-30/month VPS with 2GB RAM, 2 vCPUs, NVMe SSD (Hetzner CX21, DigitalOcean basic, Linode shared). Don't compare WordPress on a $300/month managed host to Strapi on a $5 VPS — the hosting tier is doing 50% of the work.
2. Same content volume.
Empty CMSes look fast. Real CMSes with 5,000 posts, 10K media items, 50K page views worth of analytics are slower. Seed each candidate with realistic content before benchmarking — at minimum 1,000 posts, 500 media items, real category/tag distribution. The performance gap between CMSes often appears only at scale.
3. Same caching layer state.
Run two passes: first pass with all caching disabled (page cache, object cache, query cache, browser cache via no-store header). This measures raw backend speed. Second pass with caching enabled as the candidate would normally run. Both numbers matter — anonymous traffic uses cached responses, but logged-in users, search, cart pages, and admin work hit the backend directly.
4. Same network distance.
Run the load tests from a fixed location near the server. If you're testing CMSes hosted in Frankfurt, run k6 from a Frankfurt VPS, not from your laptop in California. Network latency adds 50-200ms to every request and obscures backend differences.
5. Same realistic test pattern.
Don't test only the home page. Run all 5 scenarios above against each candidate, weighted by your real traffic mix. If your traffic is 60% blog reads, 30% search, 10% admin, weight the benchmark by those proportions. The composite score reflects real user experience.
6. Same observability.
Use the same measurement tools. Don't compare WebPageTest results from one CMS to PageSpeed Insights results from another. Pick one tool, run it against all candidates, compare the same metrics.
For the underlying architectural reasons different CMSes perform differently, see WordPress vs modern CMS: honest feature comparison and the modern CMS stack: Laravel + React + Inertia.
Reading the Numbers: What Good Looks Like
After running the 5 scenarios, you have a stack of numbers. Here's the framework for interpreting them:
| Metric | Excellent | Acceptable | Bad |
|---|---|---|---|
| TTFB (cold) | < 200ms | < 600ms | > 800ms |
| LCP (mobile) | < 2.0s | < 2.5s | > 3.0s |
| INP | < 100ms | < 200ms | > 500ms |
| CLS | < 0.05 | < 0.1 | > 0.25 |
| Query count (typical page) | < 15 | < 30 | > 60 |
| PHP memory peak | < 64MB | < 128MB | > 256MB |
| Total page weight | < 800KB | < 1.5MB | > 3MB |
| API response (10 records) | < 200ms | < 500ms | > 1s |
The "Acceptable" column is what most production sites should target. "Excellent" is what well-built modern CMS sites can hit. "Bad" is the failure mode that hurts SEO and conversions.
The single most important number: TTFB on the cold-cache scenario. It tells you the backend's true speed without cache help. Everything else is downstream of that.
For SEO ranking purposes specifically, Core Web Vitals (LCP, INP, CLS) are the metrics Google uses. Pages that fail Vitals lose ranking even when content is otherwise strong. See headless CMS and SEO for the deeper SEO connection.
Common Benchmarking Mistakes
The mistakes that produce misleading results — and how to avoid them:
Mistake 1: Testing only the home page. Home pages are usually the most-cached, most-optimized page on any CMS. Benchmarking only home pages makes every CMS look fast. Always run the 5 scenarios above.
Mistake 2: Empty content set. A CMS with 10 sample posts performs differently than the same CMS with 5,000 posts and a 2GB media library. Always seed realistic content before benchmarking.
Mistake 3: Comparing managed hosting to bare VPS. Kinsta-managed WordPress with Redis, Cloudflare CDN, and HTTP/3 will outperform a self-hosted Strapi on a $5 VPS no matter how good Strapi is. Normalize the hosting tier first.
Mistake 4: Single-shot measurements. One k6 run with 10 virtual users is a snapshot. Run each test 3-5 times, drop outliers, report median. Variance often tells you more than the absolute number.
Mistake 5: Testing on a slow network. Running Lighthouse from a coffee-shop wifi gives unreliable LCP/INP numbers. Use Lighthouse's "throttling" option set to a documented network profile (4G simulated, etc.) for repeatability.
Mistake 6: Ignoring real-user data. Lab benchmarks (Lighthouse, WebPageTest) measure controlled conditions. Real-user data (CrUX, Cloudflare Analytics) measures what actual visitors experience. Both matter; lab data alone misses tail latencies and device diversity.
Mistake 7: Forgetting the admin. Editor productivity is a real cost. A CMS that's fast for anonymous visitors but takes 5 seconds per admin click is expensive in editorial time. Benchmark Scenario 2 honestly.
Mistake 8: Ignoring plugin/extension config. WordPress with 5 plugins is a different platform from WordPress with 30 plugins. Specify the plugin/extension config explicitly when reporting numbers — see WordPress plugin bloat: your biggest liability in 2026 for why plugin count is the dominant variable.
Mistake 9: Comparing first-byte to fully-rendered. TTFB and LCP measure different things. Comparing one CMS's TTFB to another CMS's LCP makes one look faster for the wrong reason. Match metrics across candidates.
Mistake 10: Not testing at scale. Many CMSes look fine at 100 RPS and fall apart at 1,000 RPS. If your site might see traffic spikes (viral content, product launches), include a stress-test scenario at 5-10x your expected baseline traffic.
What to Do About It
If you're running a real CMS performance evaluation:
- Define your test matrix. 2-3 CMS candidates × 5 scenarios × 2 cache states (off/on) = 20-30 test runs total. Plan for 4-6 hours of focused testing.
- Set up identical infrastructure for each candidate. Same VPS tier, same OS, same database version, same network distance.
- Seed realistic content. Generate 1,000-5,000 posts, 500-2,000 media items, real category/tag/author distribution. Most CMSes have seeders or import scripts.
- Run k6 + Lighthouse CI on each candidate across the 5 scenarios. Save the raw output to a folder per candidate.
- Build a comparison spreadsheet with one row per metric, one column per candidate. Identify the wins and losses per metric.
- Weight the metrics by your traffic mix. A CMS that's slow at admin scenarios but fast at home page reads is fine for content-heavy sites; the inverse is fine for editor-heavy sites.
- Document the methodology alongside the results. Future-you and future teammates need to understand what was tested and what wasn't.
For the broader evaluation framework that includes performance as one of 10 dimensions, see how to choose a headless CMS: 10-point checklist. For specific platform picks where performance is part of the comparison, see best self-hosted CMS platforms in 2026 and the best CMS for React developers in 2026.
If your stack is Laravel + React and you're benchmarking UnfoldCMS as one of the candidates, the metrics above are what we tune against — see pricing or book a demo. We're transparent about being a young CMS; the architectural advantages (single deployable, monolithic Laravel + React, no plugin overhead) show up specifically in the cold-cache TTFB and admin-page scenarios. Image transformations and search are areas where we're still maturing.
FAQ
What's the most important metric for CMS performance?
TTFB on the cold-cache scenario, with database query count as the secondary signal. TTFB tells you the backend's raw speed without cache help; query count tells you whether the architecture is efficient or doing N+1 work. LCP and INP matter for user experience but they're downstream of backend speed — a CMS with fast TTFB usually has good LCP unless the frontend is unusually heavy.
How long should a CMS performance benchmark take?
For a real evaluation: 4-6 hours of focused testing per candidate, plus 2-3 hours for setup and content seeding, plus 1-2 hours for analysis. Total: 1-2 days for a 2-3 candidate comparison. Quicker tests (single Lighthouse run on the home page) take 15 minutes but produce misleading results.
Can I compare WordPress to a headless CMS fairly?
Yes, if you normalize the architecture. Both serve HTML to the visitor; the question is how. Test the public site rendering for both. Be honest about what each does well: WordPress's plugin economy is a feature, headless CMS's API integration is a feature. The benchmark numbers reflect different tradeoffs, not a single winner.
What's the best load testing tool for CMS performance?
k6 for scriptable scenarios with Core Web Vitals plus backend metrics. Lighthouse CI for automated frontend testing in your pipeline. Apache Bench for quick smoke tests. WebPageTest for deep waterfall analysis. Use multiple tools — each catches different failure modes.
How do I benchmark CMS performance under traffic spikes?
Use k6's stages config to ramp from 1 to 100+ virtual users over 5 minutes, hold at peak for 5 minutes, ramp down. Watch for response time degradation and error rate increase. CMSes that look fine at 10 RPS often fall apart at 100-500 RPS due to connection pool exhaustion, memory pressure, or database lock contention. Real production sites need stress-test scenarios at 5-10x baseline traffic.
Should I trust Lighthouse scores as the only benchmark?
No. Lighthouse is one tool; it measures lab conditions on a single device profile. Real-user data (CrUX, Cloudflare Analytics) often differs significantly from Lighthouse scores. Use Lighthouse as one signal alongside k6 backend tests, real-user metrics, and your own representative scenario testing.
Sources & Methodology
This post draws on:
- Google CrUX dataset — for real-user Core Web Vitals across CMS platforms in 2026
- k6 documentation — for scenario scripting patterns and fair comparison practices
- Lighthouse CI documentation — for automated benchmarking patterns
- Web Vitals Extension and Search Console reports — for production performance signals
- Hetzner / DigitalOcean / Linode benchmark publications — for VPS-tier baselines
- First-hand testing — UnfoldCMS team has run cross-CMS benchmarks across WordPress, Strapi, Payload, Sanity, and UnfoldCMS in 2024-2026 migration assessments. The metric thresholds reflect what we actually observed.
Disclosure: this post is on a CMS vendor's blog. The methodology is platform-agnostic — every fairness rule and metric threshold applies regardless of which CMS you're evaluating. The "what good looks like" thresholds are calibrated against real production sites we've audited; your acceptable thresholds may differ based on traffic patterns, conversion sensitivity, and SEO competitiveness in your space.
Performance is one of several dimensions to evaluate when picking a CMS. For the full evaluation framework, see the 10-point headless CMS checklist. For platform-specific performance angles, see WordPress performance problems: why your site is slow, WordPress plugin bloat, and the modern CMS stack: Laravel + React + Inertia.
Free & Open Source
Own your CMS. No subscriptions.
Unfold CMS is free to download and self-host. Built on Laravel + React, full source code included.
Share this post: